Driver-Based Financial Data Modeling
Project Overview
Summary
Jirav is a financial planning and analysis platform used by finance teams to build budgets, forecasts, and financial models. I designed the Budget Drivers feature end-to-end: a system that lets users attach calculation logic to any line in a financial plan. Working directly with Martin (CEO and former CFO), I mapped the full driver architecture across 8 driver types and 12 distinct user flows, designing 184 artboards in Sketch. When the original InVision prototype became unavailable, I used Claude to reconstruct the complete UX specification, user flow diagram, and this portfolio documentation from the raw Sketch source file.
Problem to Solve
Finance teams using Jirav needed a way to model budget assumptions programmatically, not just enter numbers manually, but attach repeating logic that would drive forecasts automatically. A Wages and Salaries line might need to grow based on headcount assumptions. A marketing budget might need to track as a percentage of another account. Different accounts require completely different logic.
The challenge was designing a single, coherent configuration system that could accommodate 8 structurally different driver types, each with its own inputs, pickers, and edge cases, while keeping the experience fast and consistent for finance users who already understand the domain but don’t want to learn a complex tool.
A second challenge emerged later: the original prototype was lost when InVision shut down. All design artifacts had to be reconstructed from the Sketch source file using Claude.
Process
Discovery and Collaboration with Martin
I worked directly with Martin, Jirav’s CEO and a former CFO, throughout the design process. His domain expertise was essential. The driver system encodes real financial reasoning: which base period options a finance team actually needs, how headcount assumptions should link to expense accounts, when a periodic increase starts and how its base is calculated. These decisions cannot be made by intuition alone.
Our sessions shaped the overall architecture: the shared config panel pattern used across all 8 driver types, the entry flow from the budget table, the formula bar summary that appears after a driver is saved, and the granular logic inside each driver type.
Design: 184 Artboards in Sketch
I designed every screen state across 12 flows: config panels, account and department pickers, assumption-linking modals, formula bar saved states, edit loops, clone flows, bulk selection states, and the standalone Drivers Module. Each artboard was numbered and named to a consistent TOC convention.
The driver type picker required careful thought. It had to surface 8 options clearly at the decision point, with enough context for finance users to choose correctly without needing documentation.
AI-Assisted Process Documentation
When the InVision prototype became unavailable, I used Claude to reconstruct the full project record. Claude parsed the raw Sketch JSON, reading 184 artboard names, extracting text layer content and formula bar strings, inferring screen transitions from adjacent artboard deltas, and mapping the complete flow structure. From this, Claude produced a structured UX specification document, two flow diagrams importable into Figma, and this portfolio case study.
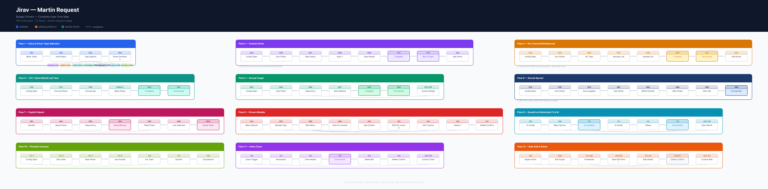
The user flow diagram below was generated by Claude from the recovered Sketch data. It maps all 12 flows as color-coded swim lanes, showing entry points, screen-to-screen transitions, branch conditions, and saved states across the full system.
User flow diagram generated by Claude from the Sketch source file. 12 color-coded flows, 93 screen nodes, directional arrows for forward transitions and edit loops.
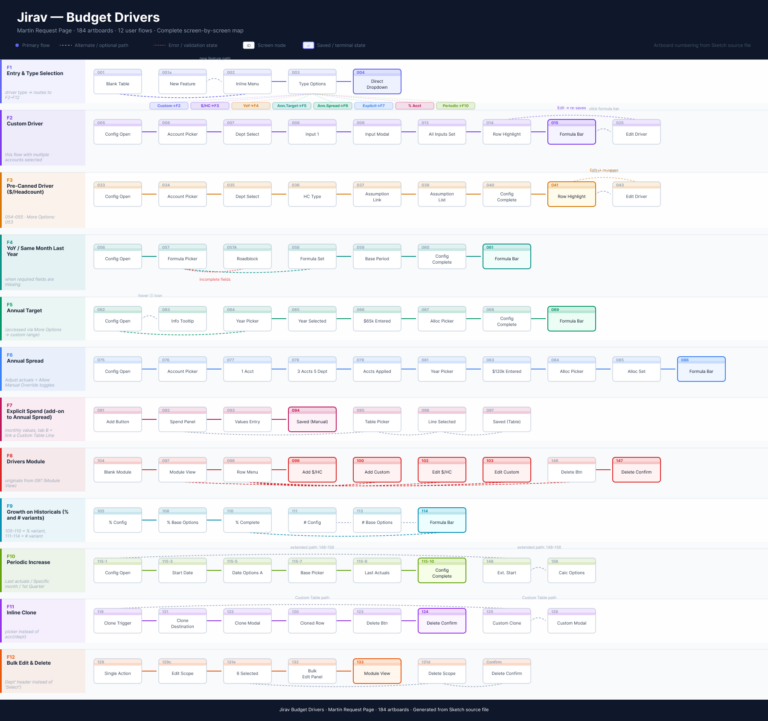
Flow Map
The flow map below shows all 184 artboards across the 12 driver flows as a single reference. Each swim lane represents one flow, with artboard IDs, screen names, and navigation connections. This was also generated by Claude from the raw Sketch JSON and is importable into Figma.
Outcomes
The driver system shipped as a core part of Jirav’s budget modeling experience. The shared panel architecture meant that once a finance user understood how to configure one driver type, the pattern transferred directly to all others. Account and department selection, fiscal year scoping, formula operators, and the formula bar summary all worked identically across Custom, $/Headcount, Annual Spread, Annual Target, Growth on Historicals, Periodic Increase, Explicit Spend, and Percentage of Another Account. Eight different driver types, one consistent mental model.
The formula bar proved to be one of the more important design decisions. Rather than requiring users to re-open a driver to understand what it was doing, the bar surfaced the full configuration as a readable string directly in the budget table: account, driver type, inputs, and their operators at a glance. It also served as the edit entry point, keeping the table and the configuration tightly connected.
The Drivers Module gave teams managing large numbers of drivers a dedicated place to see everything at once, across Revenue, COGS, and OpEx, without navigating row by row through the budget table. Bulk edit and clone flows reduced the repetitive work of applying the same logic across multiple accounts and departments.
Business Impact
The Budget Drivers feature gave Jirav’s finance users the ability to build model-driven forecasts directly inside the platform, eliminating the spreadsheet exports and manual formula maintenance that had been the workaround before. Martin’s direct involvement meant the feature reflected how CFOs actually think about modeling. The driver logic was not approximated. It was built to the exact options and edge cases that a finance team would reach for in practice.
Client
Jirav
Services
- Information Architecture
- Wireframes
- User Experience Design
- User Interface Design
- Visual Design
- User Flows
Tools
- Sketch
- InVision
- Figma
- Claude/ChatGPT
Design Elements
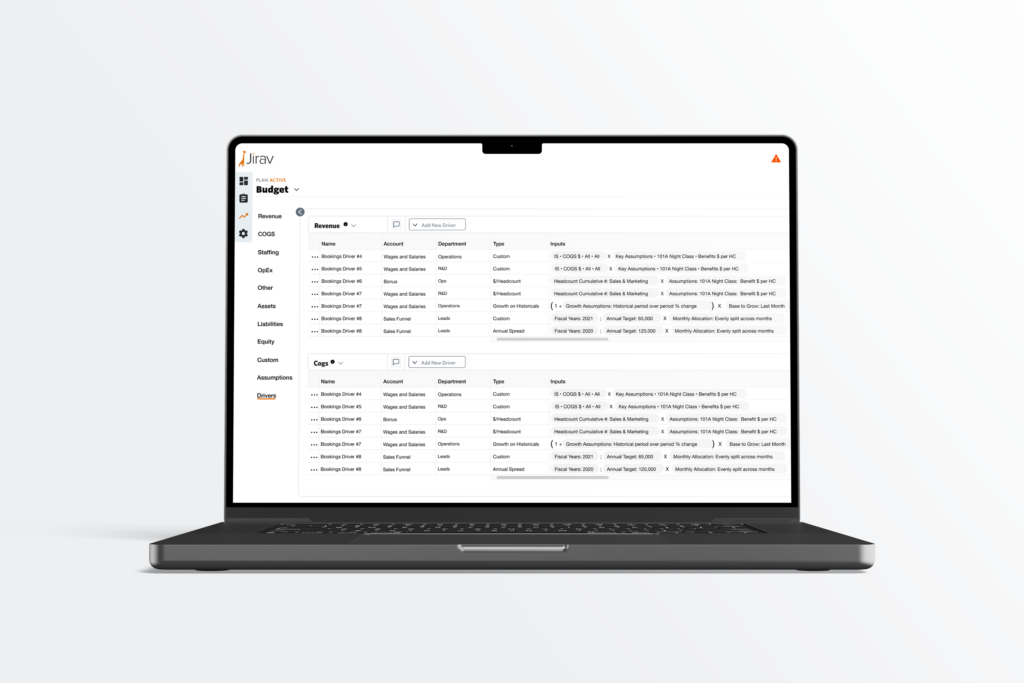
Designs
Note: because of the way the application was built, screenshots are unusually wide and are presented individually.
New Feature Introduction
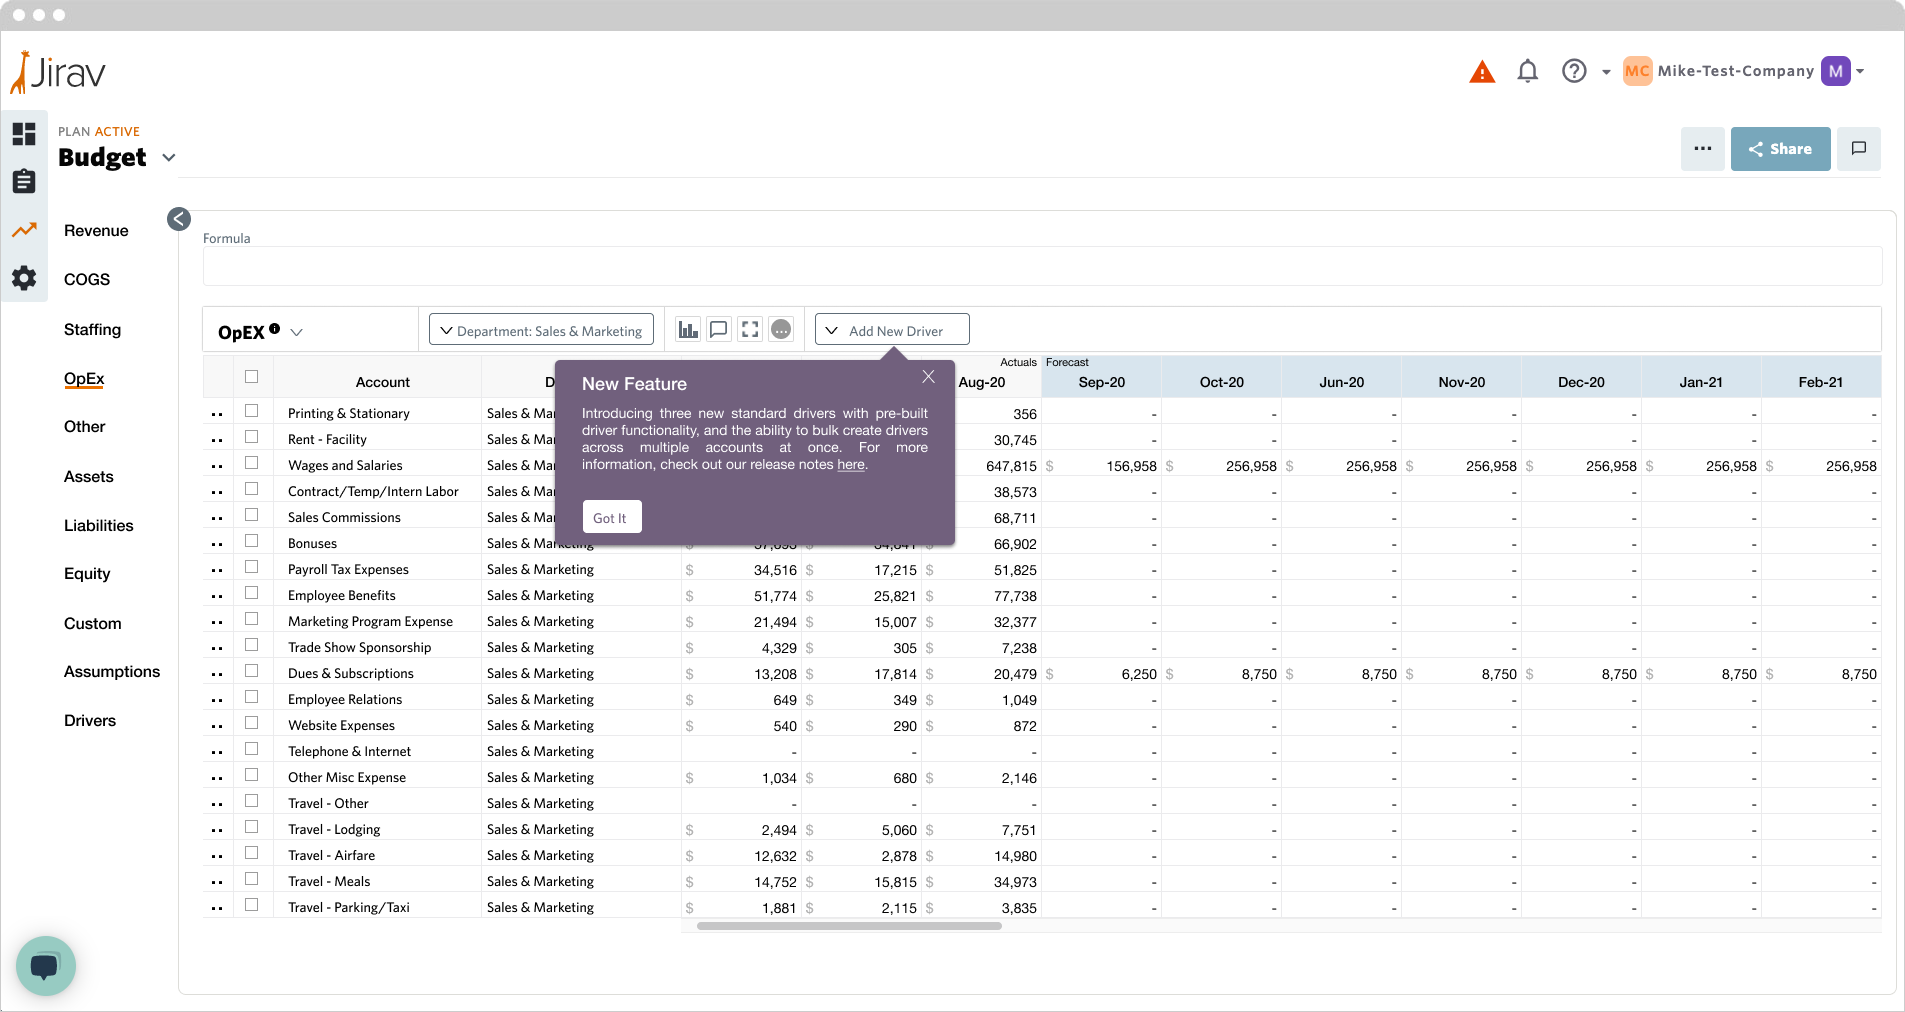
The budget table is the entry point. Each row shows actuals and forecast columns, with a “···” action menu on every line. The “Add New Driver” button in the toolbar provides a second entry path. Both routes lead to the same driver type picker, keeping the experience consistent regardless of how users initiate it.
Driver Type Selection
Clicking the “···” on any row opens an inline menu with “Add Driver” as a primary action. Expanding it reveals all 8 driver types: Growth on Historicals, Based on % of Another Account, Based on $/Headcount, Annual Target, Annual Spread, and Custom, each with a help icon. This single screen establishes the full scope of the system.
Account and Department Picker
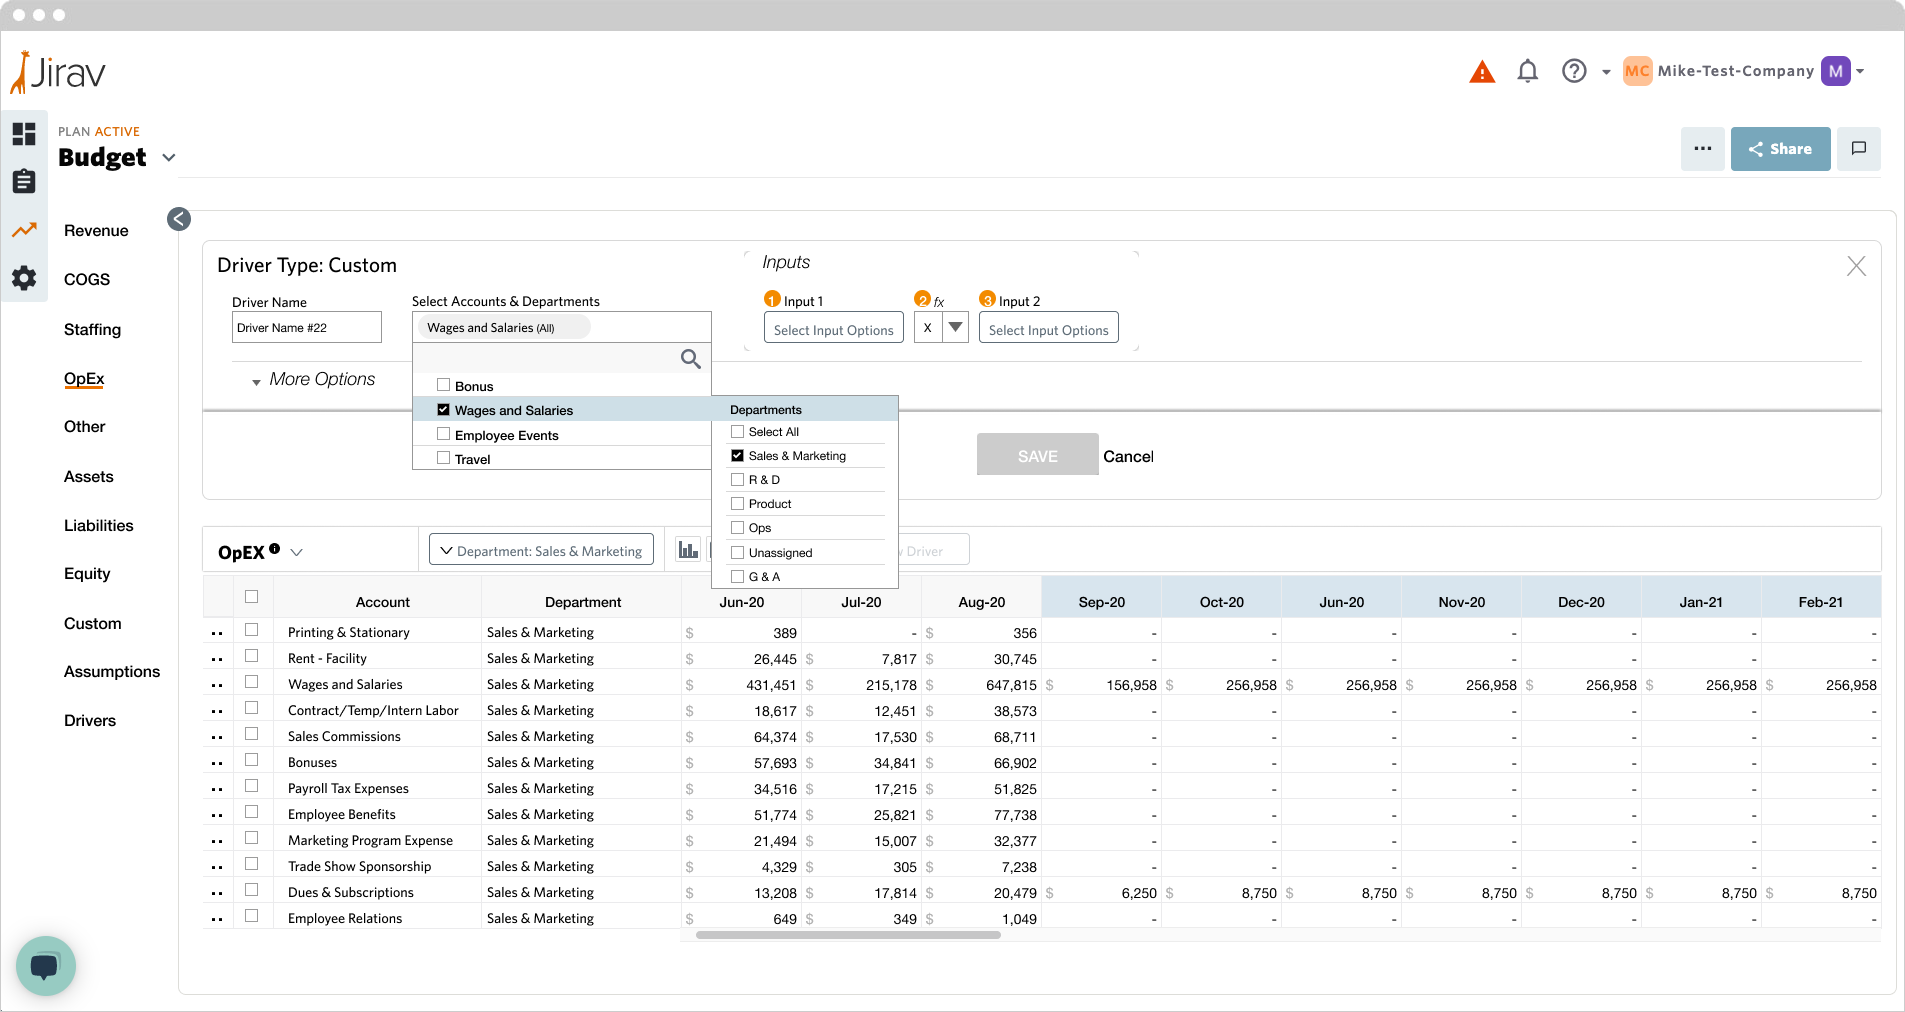
The Account and Department picker is the core reusable component shared across all 8 driver types. Users select one or more accounts, then a secondary tier reveals department checkboxes for each. The field shows a summary chip such as “Wages and Salaries (Sales & Marketing)” or “Bonus (All) Wages and Salaries (5) +2”, giving a compact, scannable record of the selection without leaving the panel.
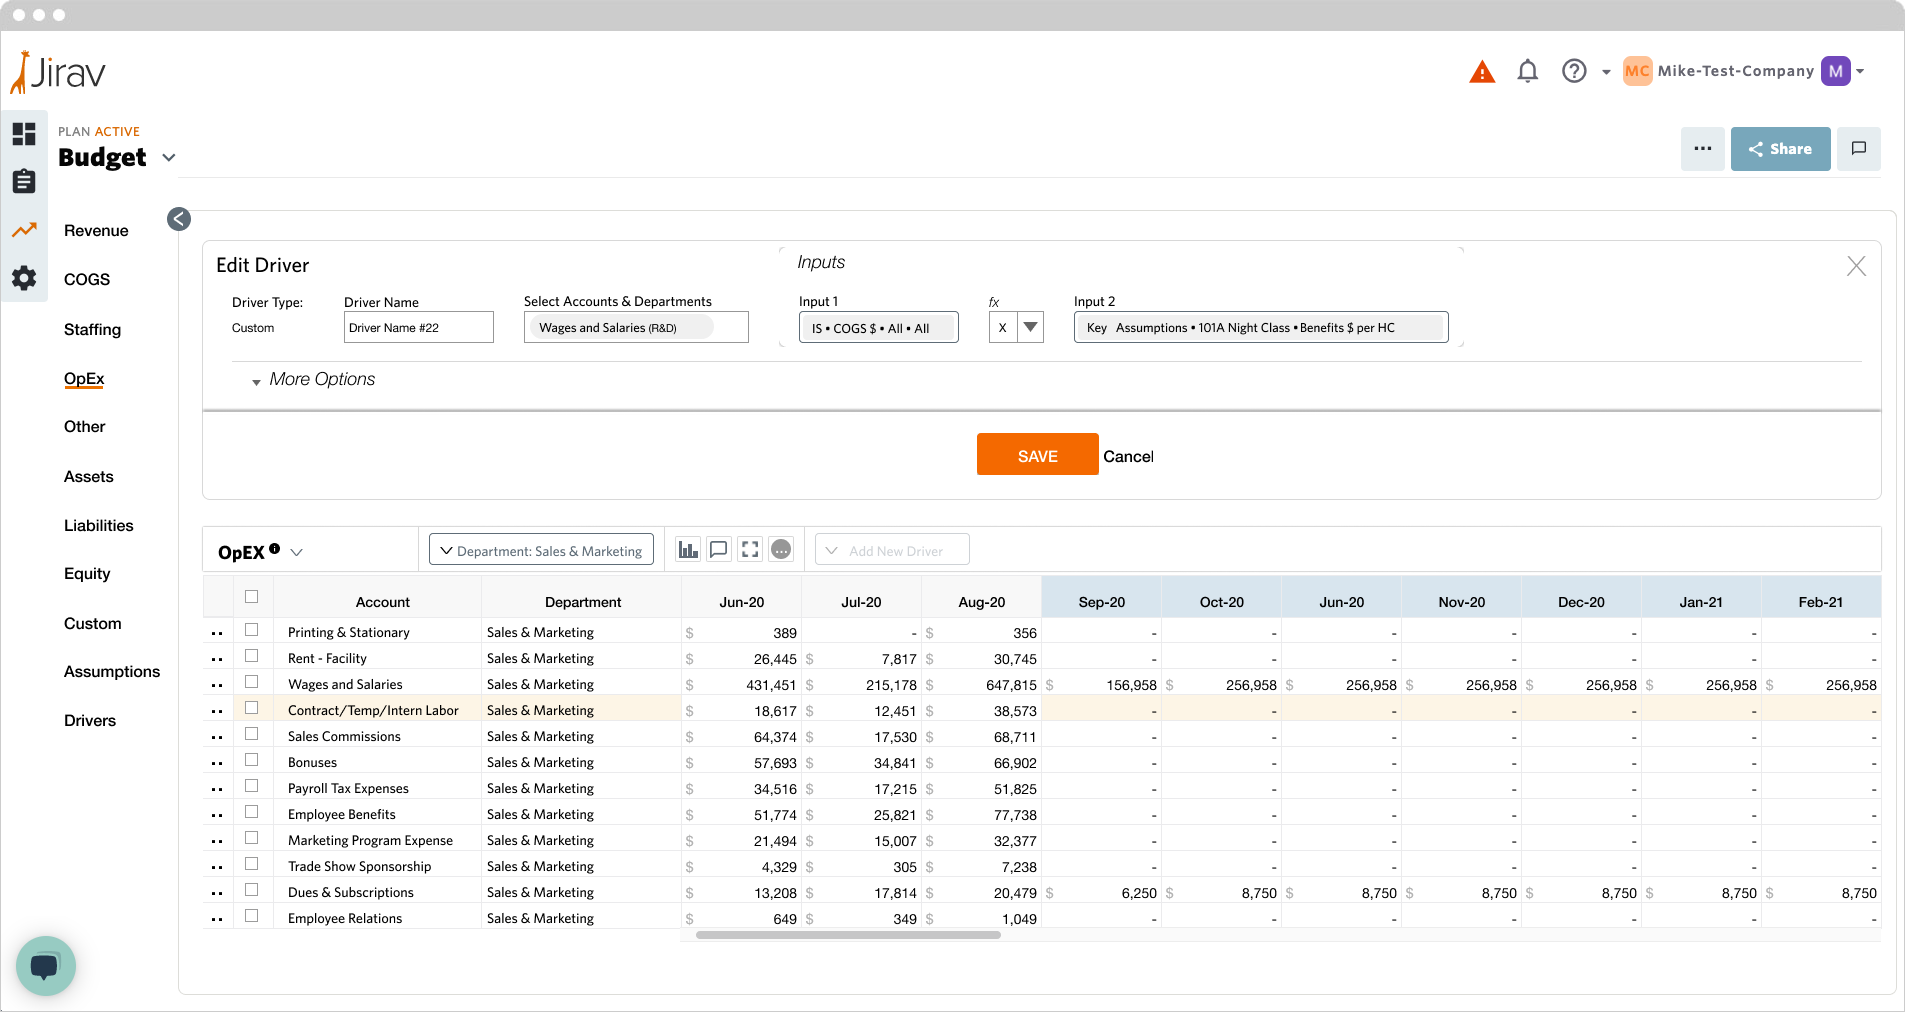
Custom Driver: Full Configuration
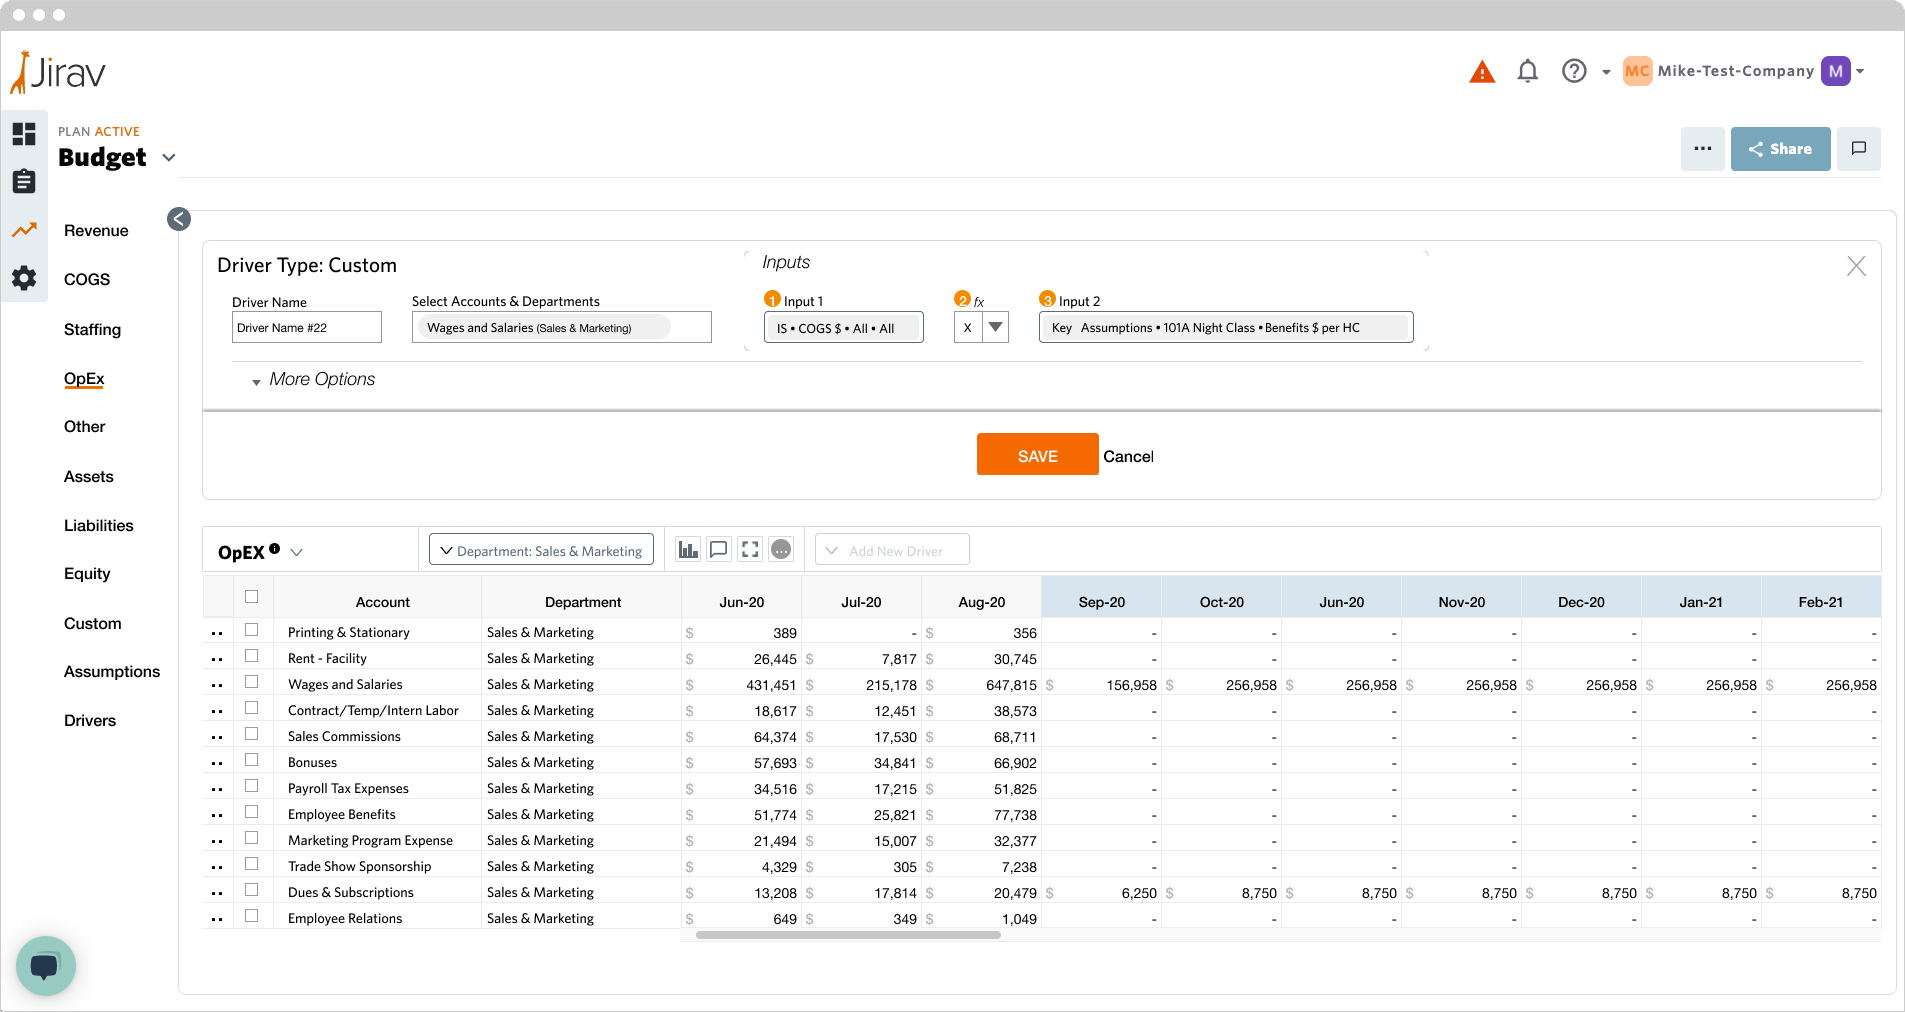
The Custom driver lets finance teams build arbitrary formulas from financial statement data and key assumption sets. Input 1 references an account category, a formula operator connects them, and Input 2 links to a named assumption. Both inputs are configured through dedicated modals that keep the picker context visible behind.
Formula Bar: Saved State
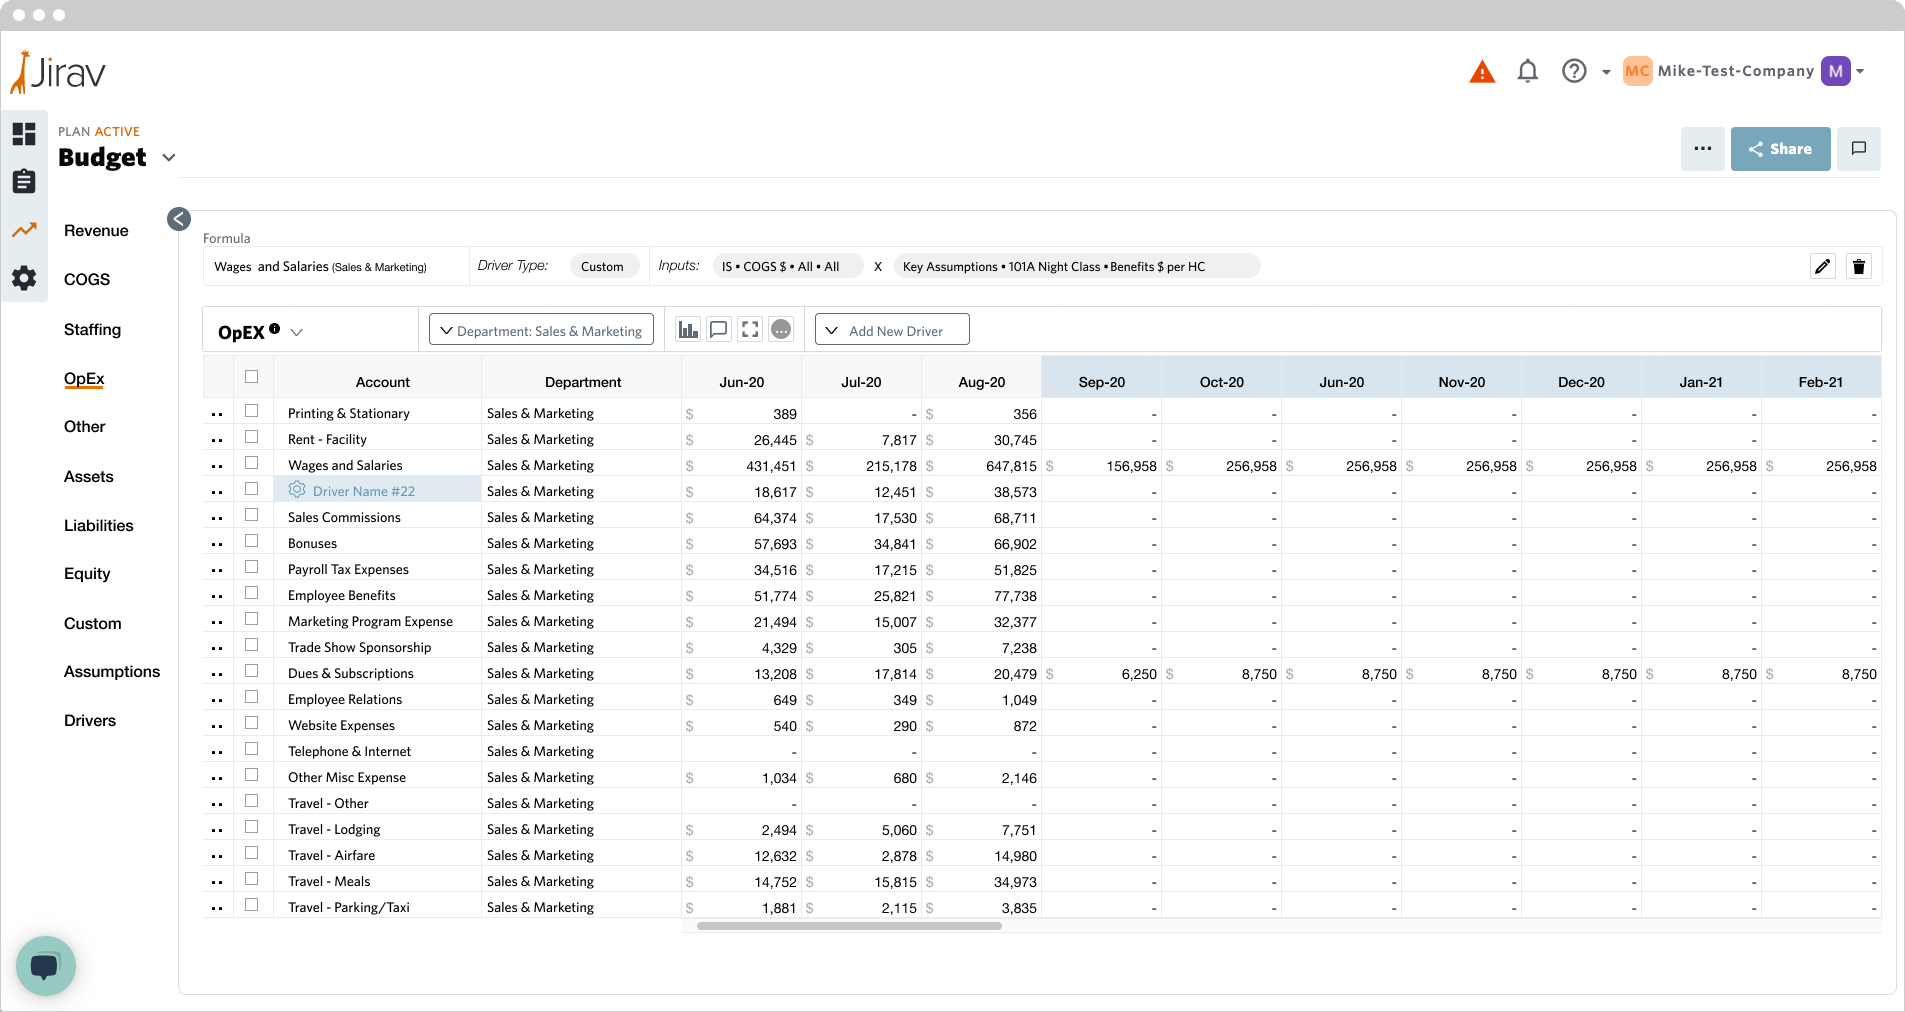
After saving, the config panel closes and the formula bar appears above the table. It encodes the full driver configuration as a readable string: account, driver type, inputs, and their operators. The driver appears as a highlighted sub-row under the parent account, showing it is live. Clicking the formula bar re-opens the config panel for editing.
$/Headcount Driver: Assumption Linking
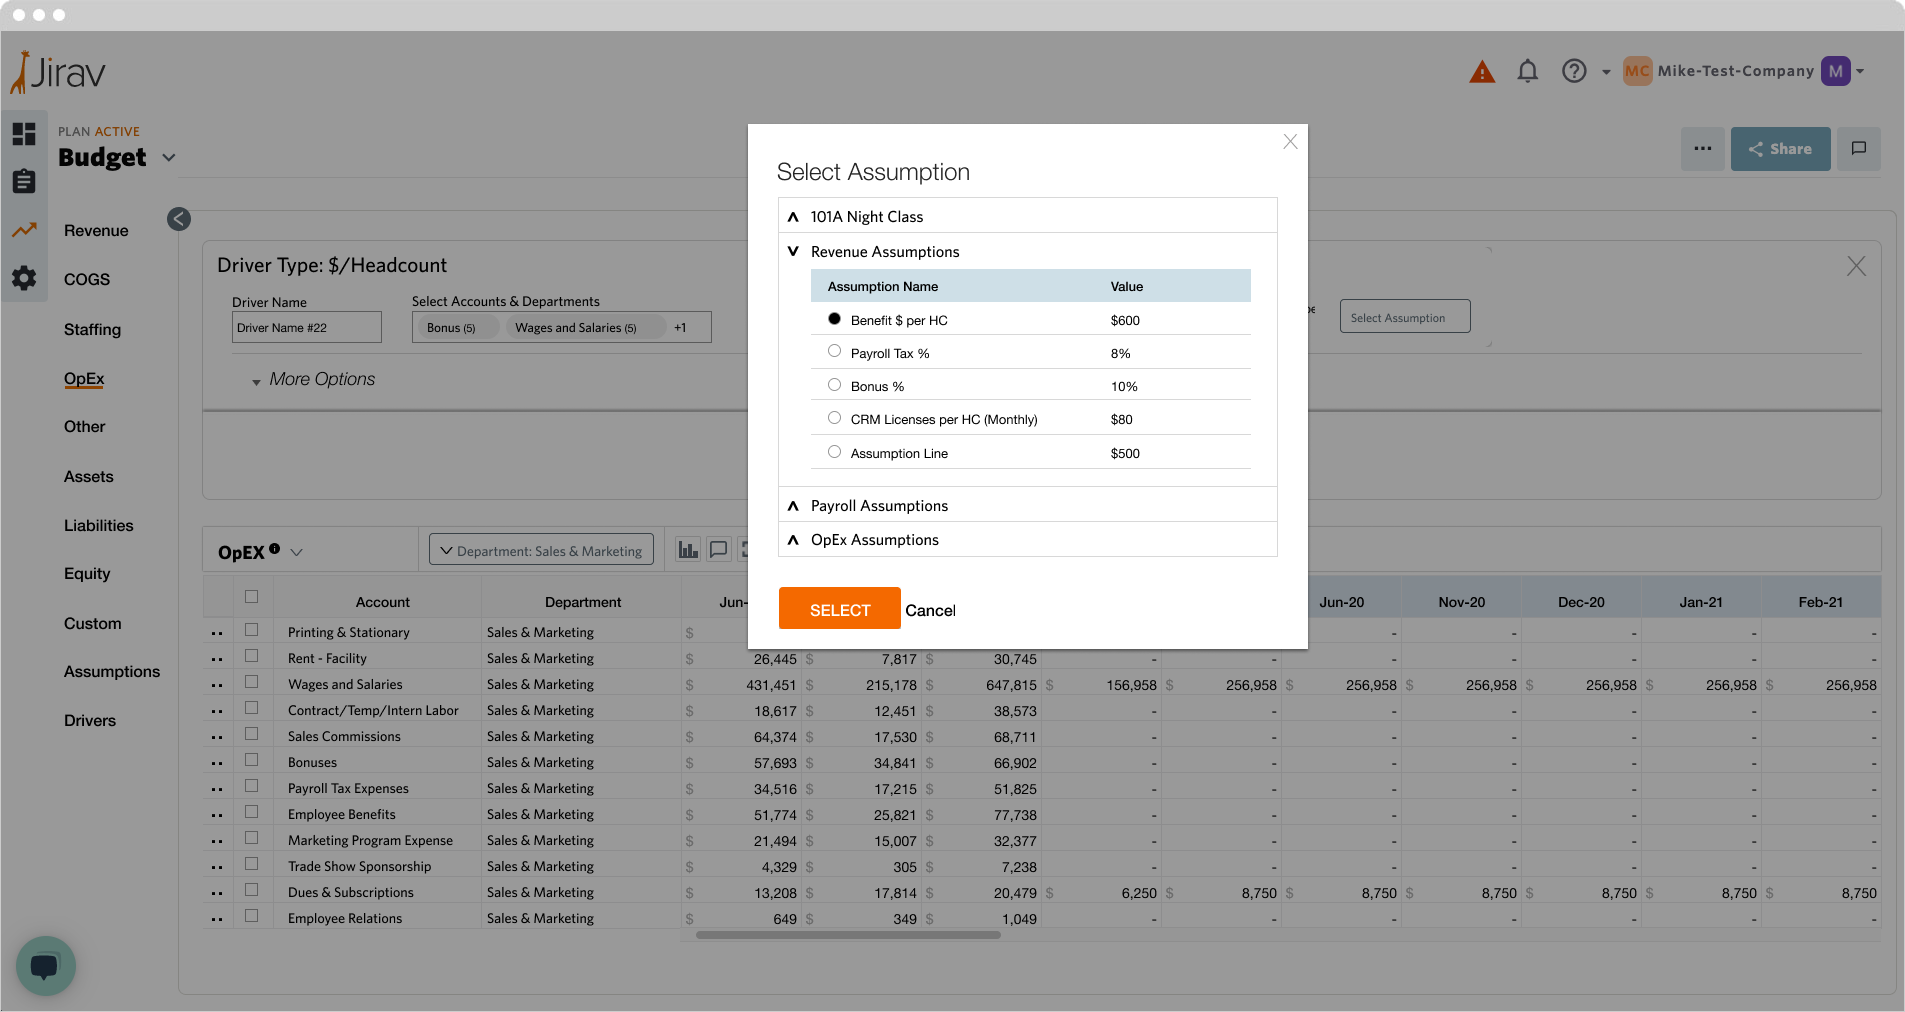
The $/Headcount driver connects expense accounts to headcount data via a named assumption. The Select Assumption modal organizes assumptions hierarchically by category, then by individual lines with their current values. Selecting one populates the assumption field in the config panel and enables the SAVE button.
Edit Driver
Re-opening an existing driver from the formula bar or the row action menu loads an Edit Driver panel that is structurally identical to the creation panel, but with all fields pre-populated. The header changes from “Driver Type: Custom” to “Edit Driver” to signal context. Edits can be made to any input without starting over.
Drivers Module
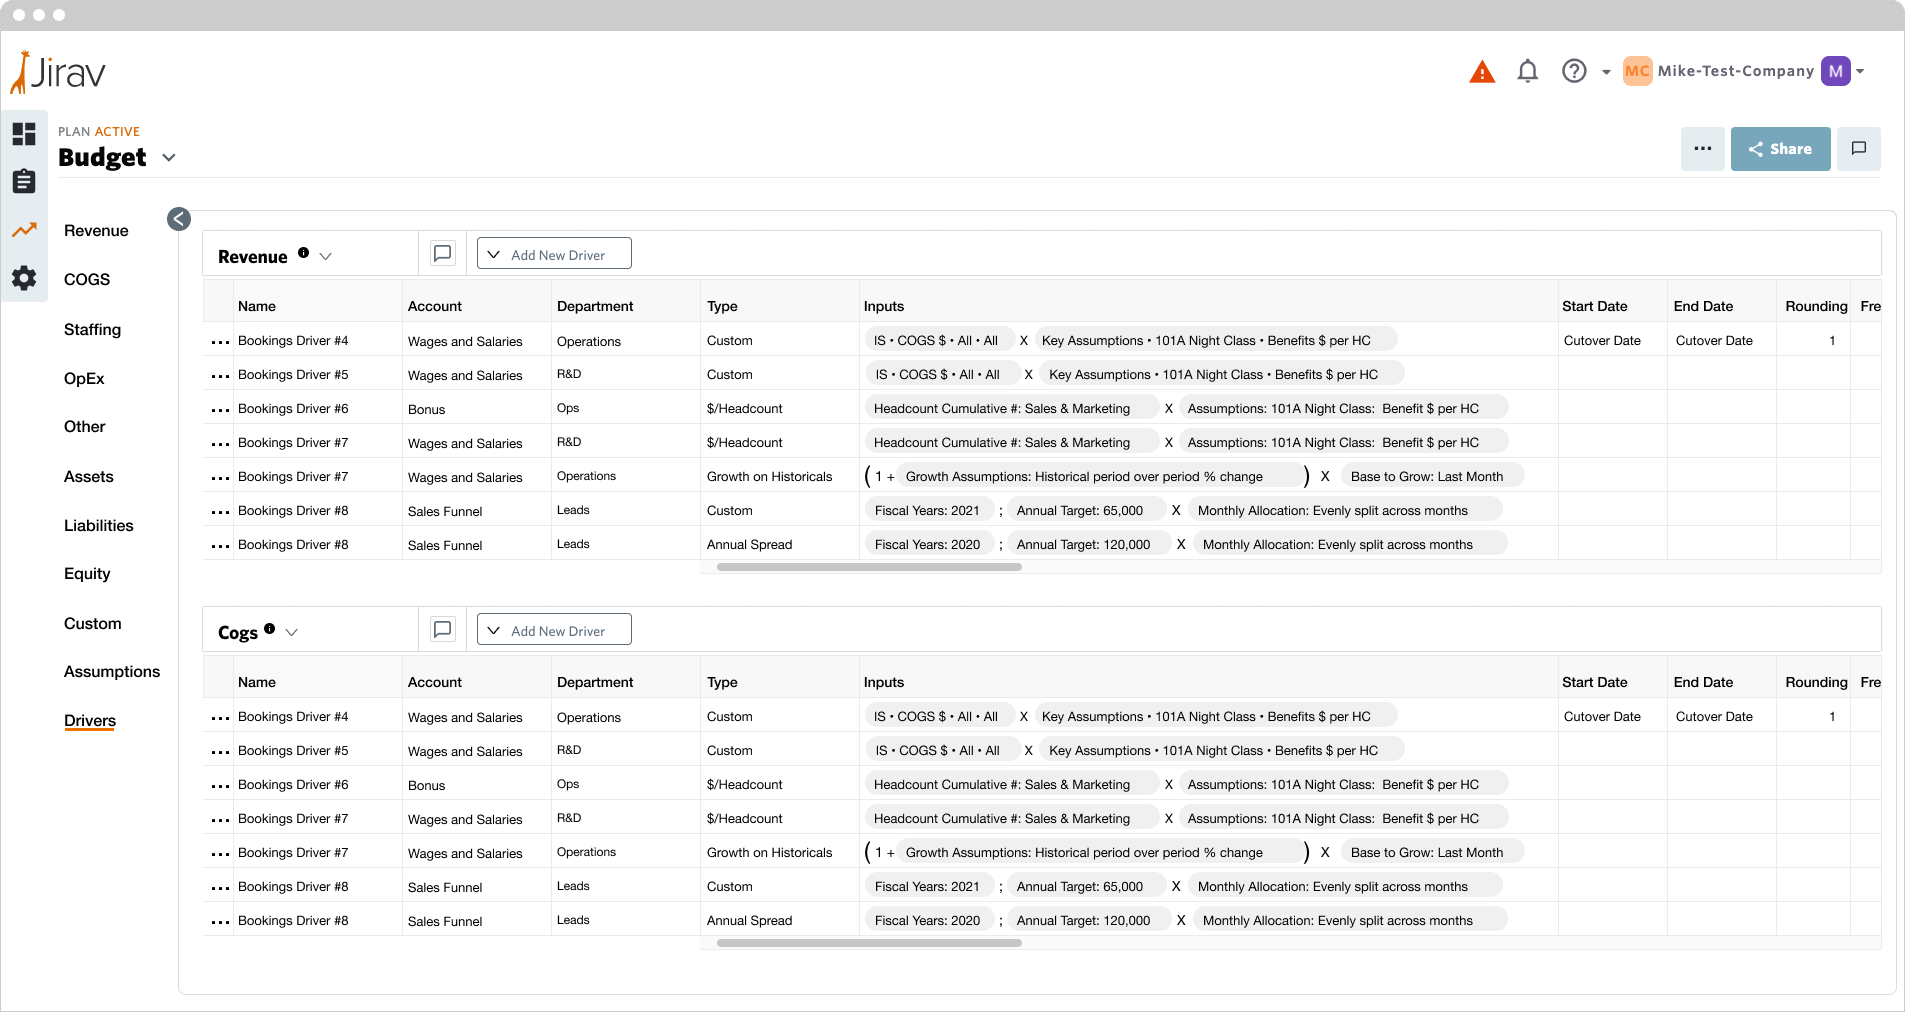
The Drivers Module is a standalone panel accessible from the left nav that shows every driver across all budget sections in a single view, organized by Revenue, COGS, and OpEx. From here, users can add, edit, delete, or clone drivers without navigating to individual budget rows.
Clone Driver
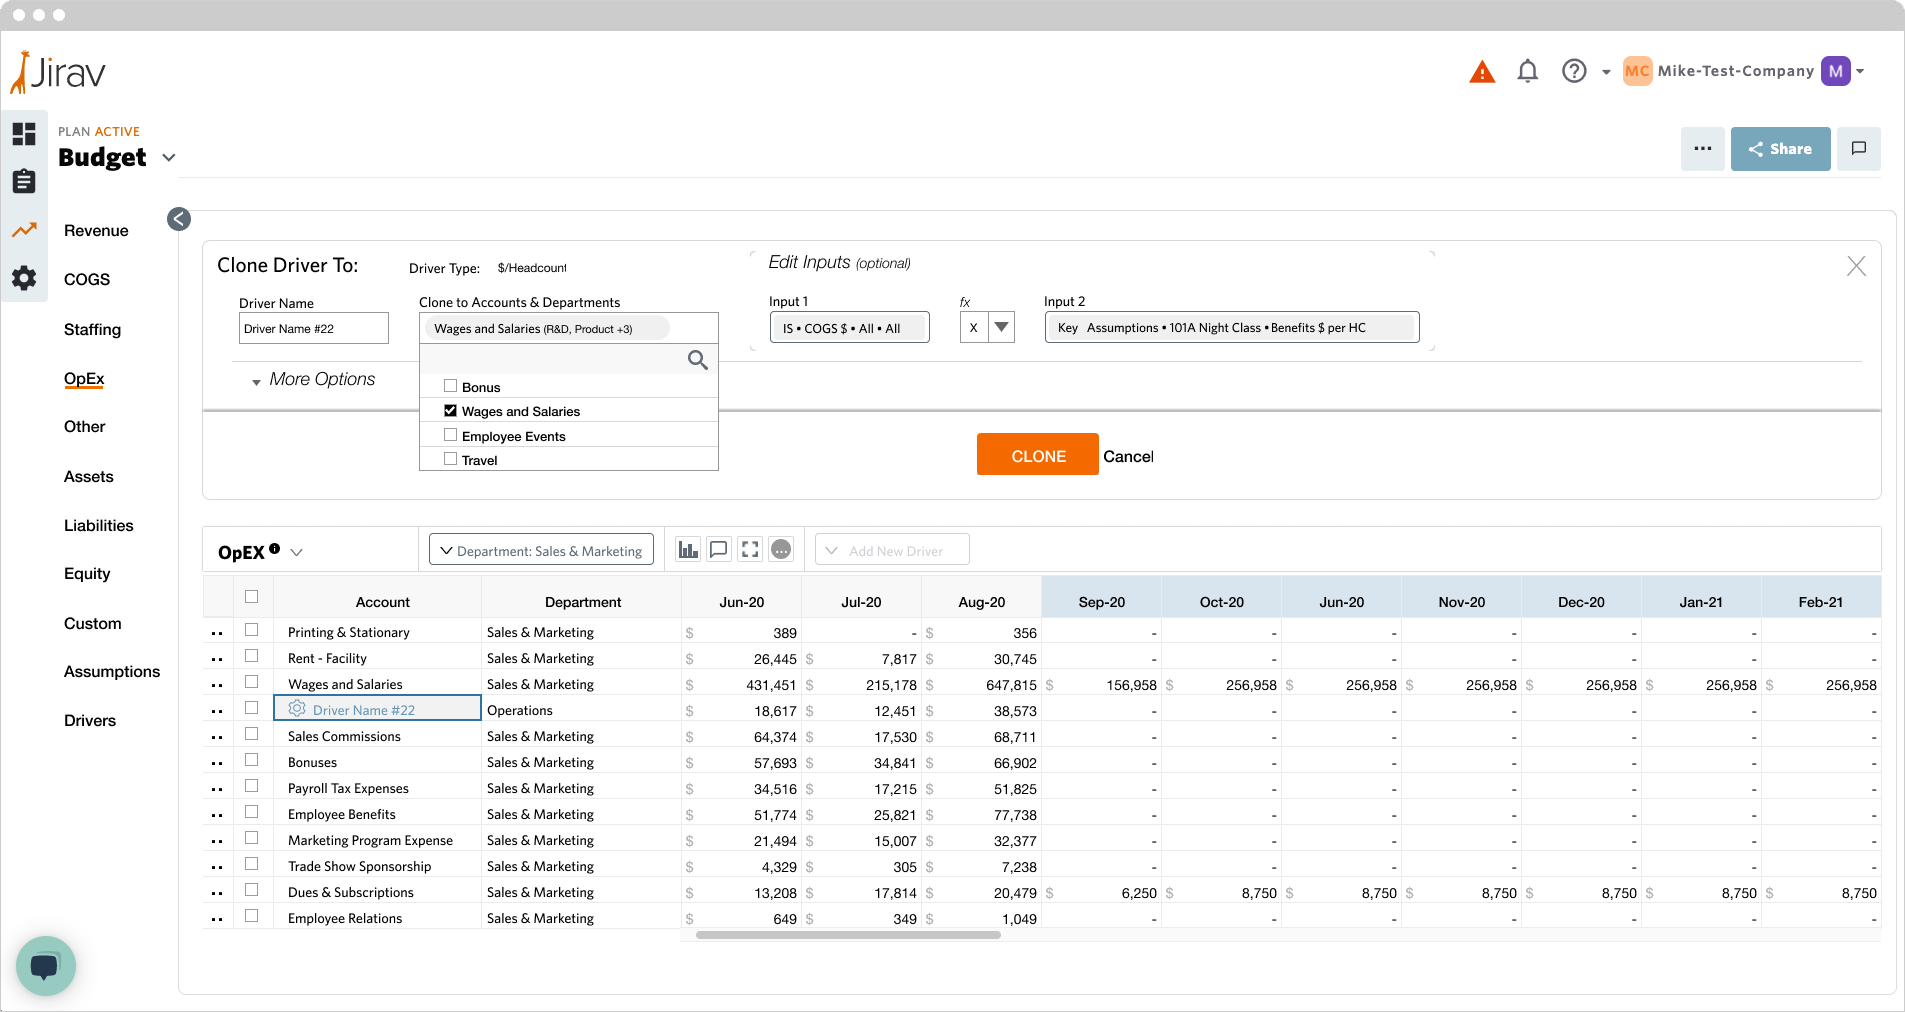
The Clone flow lets users duplicate an existing driver to one or more target accounts or departments. The modal shows the destination picker, an editable Driver Name field, the original driver type and inputs as read-only context, an optional Edit Inputs accordion, and a Copy Drivers CTA.
Bulk Edit and Delete
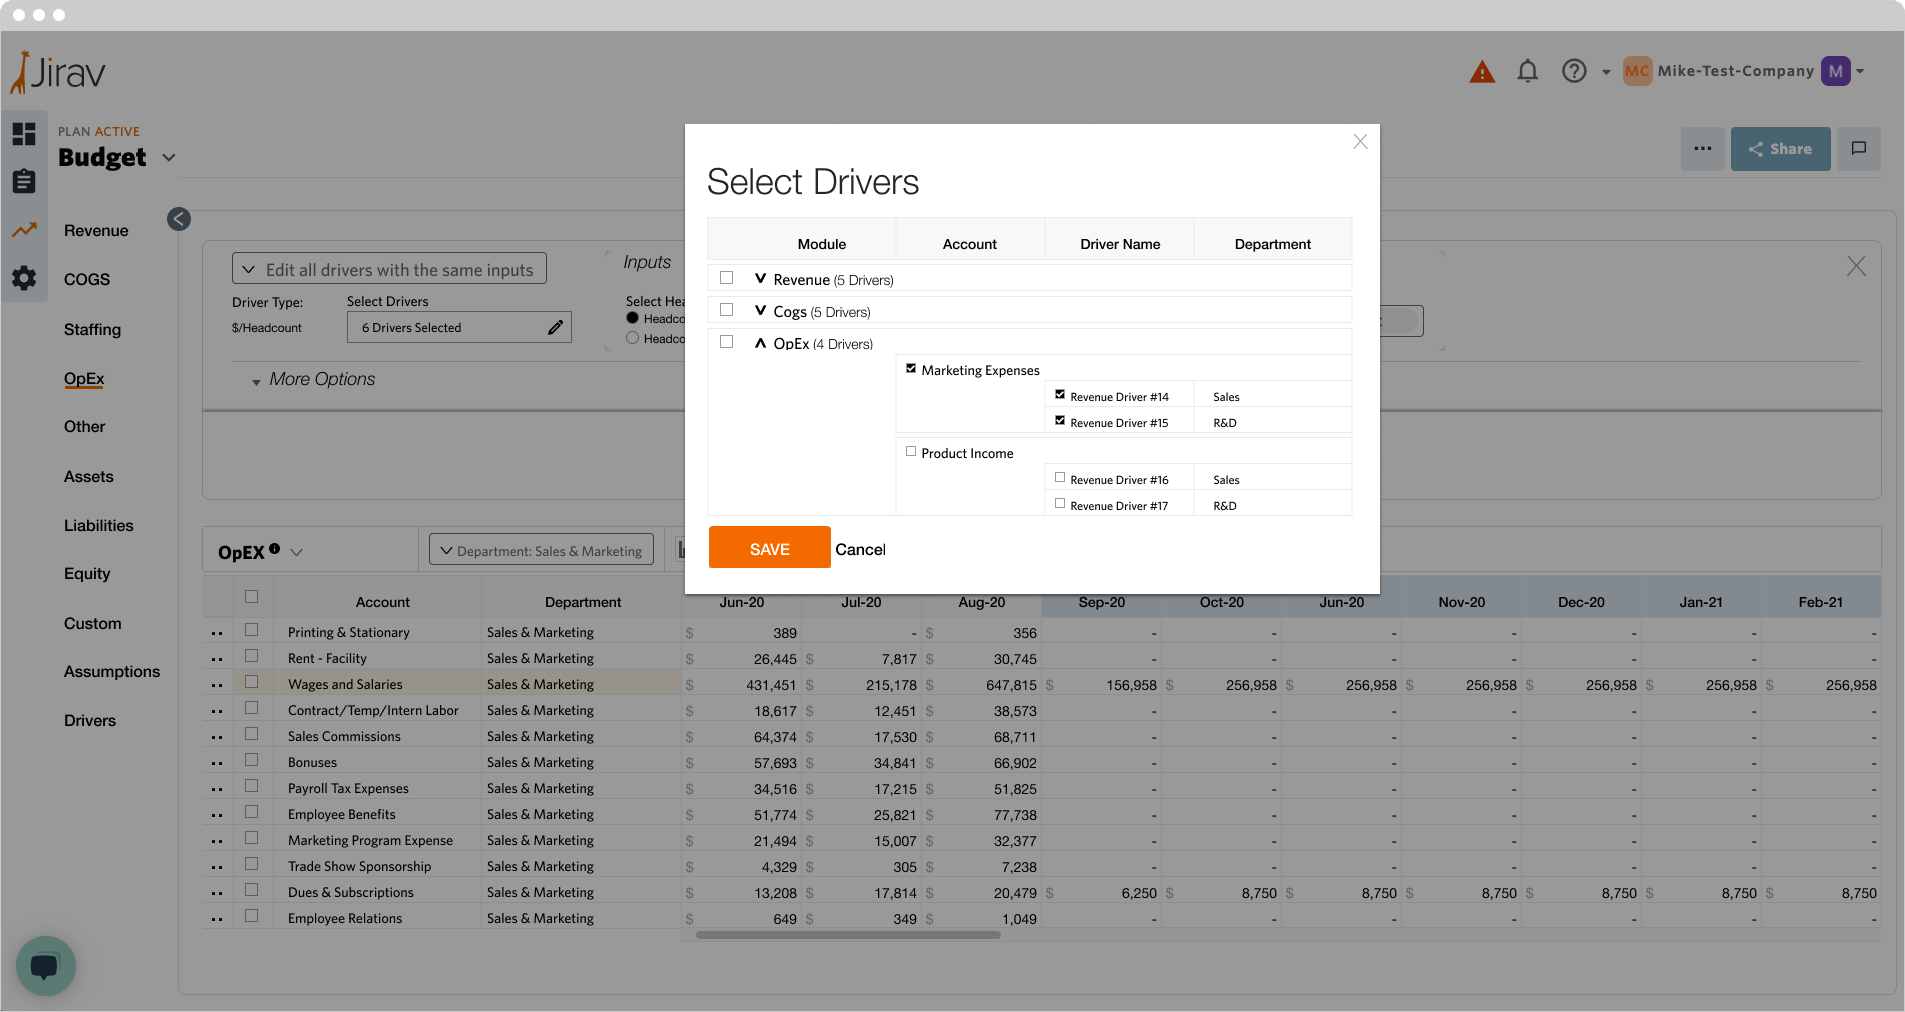
Bulk operations allow editing or deleting multiple drivers with the same inputs simultaneously. The Edit Scope picker offers “Edit this driver” for a single edit or “Edit all drivers with the same inputs” for a batch update. Selecting batch mode shows a count badge and a list of all affected drivers organized by module. One save updates all of them.