Baxter:
ShareSource

Summary

Project Overview

Baxter has an at home kidney dialysis machine that is remotely controlled by a software called Sharesource. Sharesource was set up to allow doctors, nurses & clinicians to both track patient progress and remotely update the at home devices. This software was very powerful but was difficult to use. Baxter had received several complaints about the usability of the software, it took a long time to do minimal tasks.
 
Baxter hired an outside agency to interview users. The agency went to several countries including Columbia, the UK, Japan, etc to interview users. They compiled their findings and came to the conclusion Sharesource was difficult to navigate. I was hired to update Sharesource and improve the navigation.

Client

Baxter

Services

  • Information Architecture
  • Wireframes
  • User Experience Design

Tools

  • Sketch

Process

Discovery

I was trained on the application and paired with two nurses who had 30+ years dialysis experience. I also spent a week going through the outside agency’s research. I listened to 10 hours of recorded meetings and reviewed all their submitted documents. I came to the conclusion the navigation needed to be restructured and shortcuts needed to be added. I also noticed all users had the same view so I suggested allowing each user to create a few patient lists so they could find patients easier.

Design

Because navigation was the primary concern I focused on simplifying it. I started with a few pencil sketches, did wireframes and then multiple iterations of final designs in the form of InVision prototypes. I verified everything with the nurses to make sure my ideas were possible. My first draft was a little more ambitious than what Baxter was looking for, I had to scale back my ideas so they could be implemented by the development team with their existing technology and timelines.

Designs Round 1: I did design heavy wireframes and added notations to better explain my ideas since this was a major departure from what Baxter originally had.

Designs Round 8: The last round of wireframes I created. It was at this round where design and technical limitations came into play and I had to change my designs to match their existing styles.

Discovery Elements

Outcomes

Designs

Patient Dashboard

The patient dashboard is the “heart” of Sharesource. It is where medical professionals go to see their lists of patients, get a glimpse how they are doing and link to different actions.
 
During research interviews users complained it was difficult to navigate to a patient, perform an action, create a personal patient list or filter patients. In the dashboard the user can see how their patients performed on their last 7 dialysis sessions. They can click on any of the days to see additional details and can use the icons at the end of the row to see a patient snapshot or check device settings. Lastly, a user can use the tabs above the list to navigate between their own patients and the entire list. This helped users filter patients quicker instead of having to scroll to find their next patient.

Dashboard Tool Tips

I was introducing new icons to Sharesource and I used tooltips to help users learn what the different icons meant.

Dashboard Filters

The patients are filtered by Physician, Treatment Progress and Date.

Filtered View

The date column is highlighted to draw attention as the dashboard always has a 7 day view.

Dashboard Legend

Patient Search

Due to technical reasons the patient search had to be a separate screen from the dashboard.

Treatment snapshot

This gives physicians an overview of how a patient is doing. Note the Next and Previous Patient buttons on the left & right of the screen. This is to help with inter-patient navigation. In the original app the user would have to navigate back to the dashboard to select their next patient. These buttons follow the patient order of the dashboard view (it accounts for filtering).

Treatment Summary by the Day

Device Settings

Allows user to make changes to the device(s) a patient is using.

Homepage

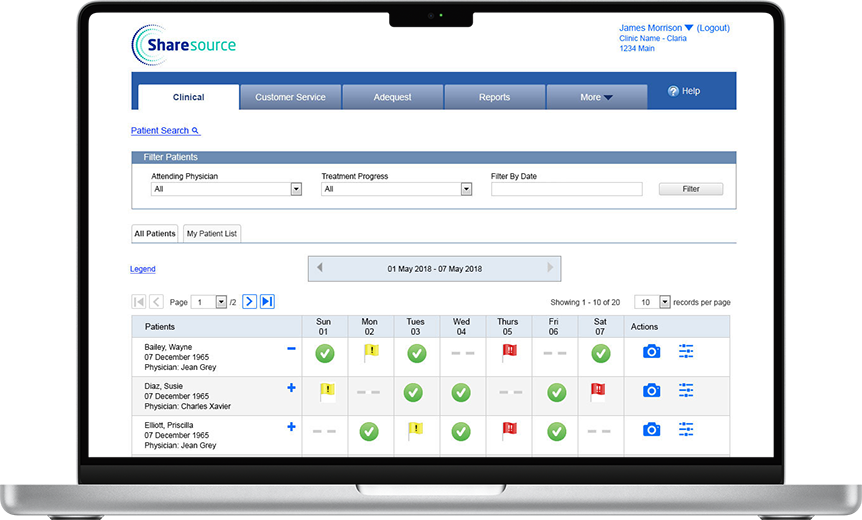
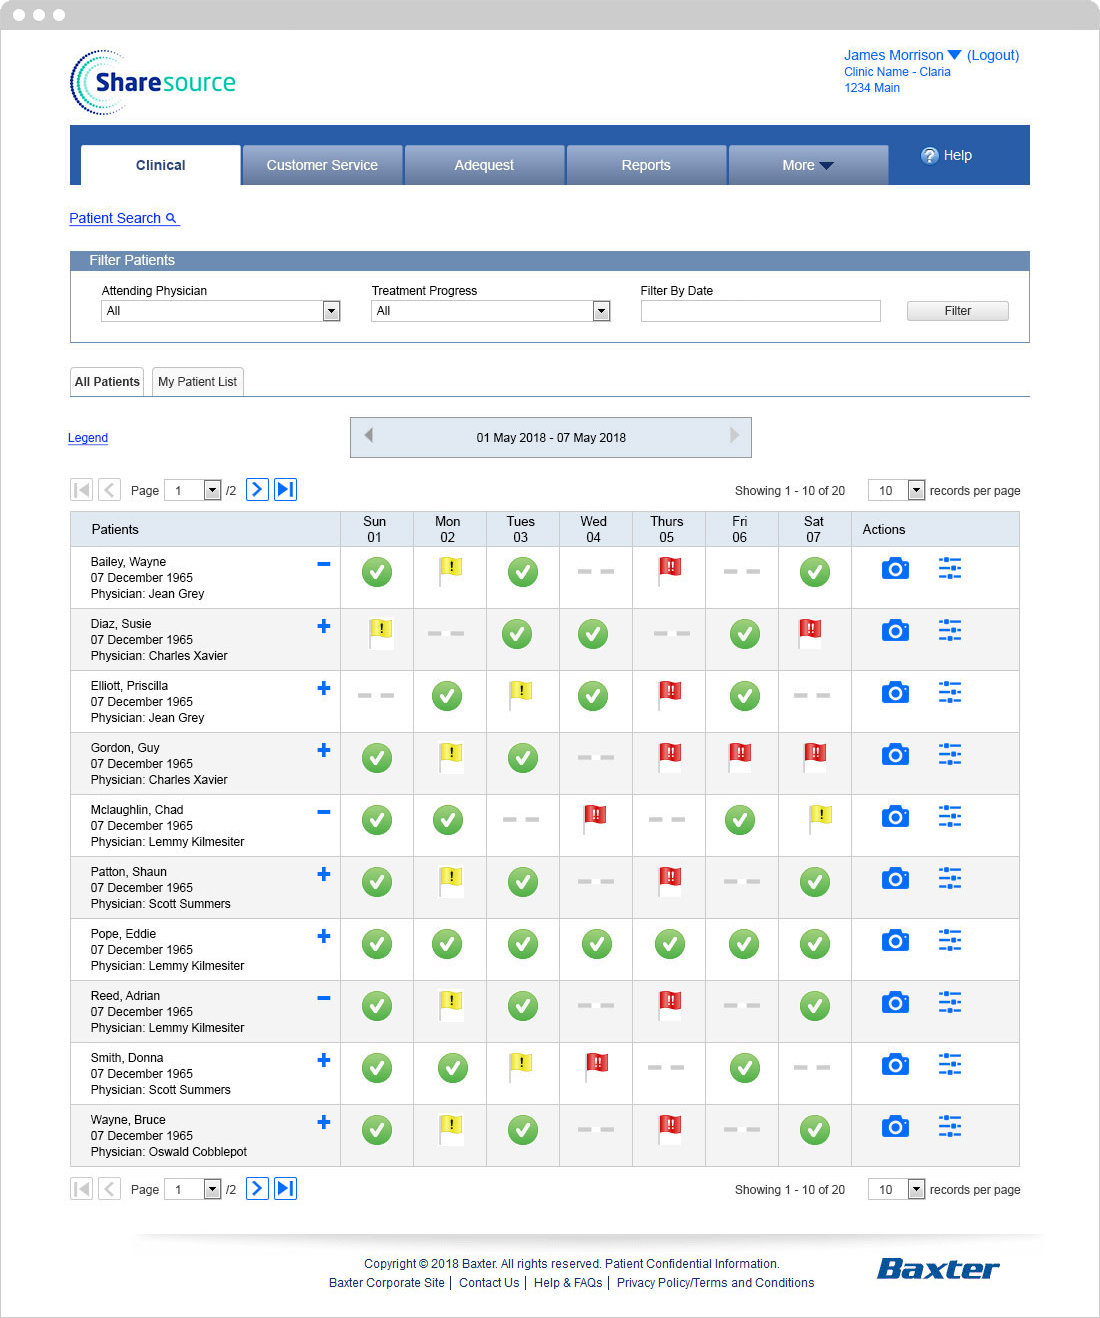
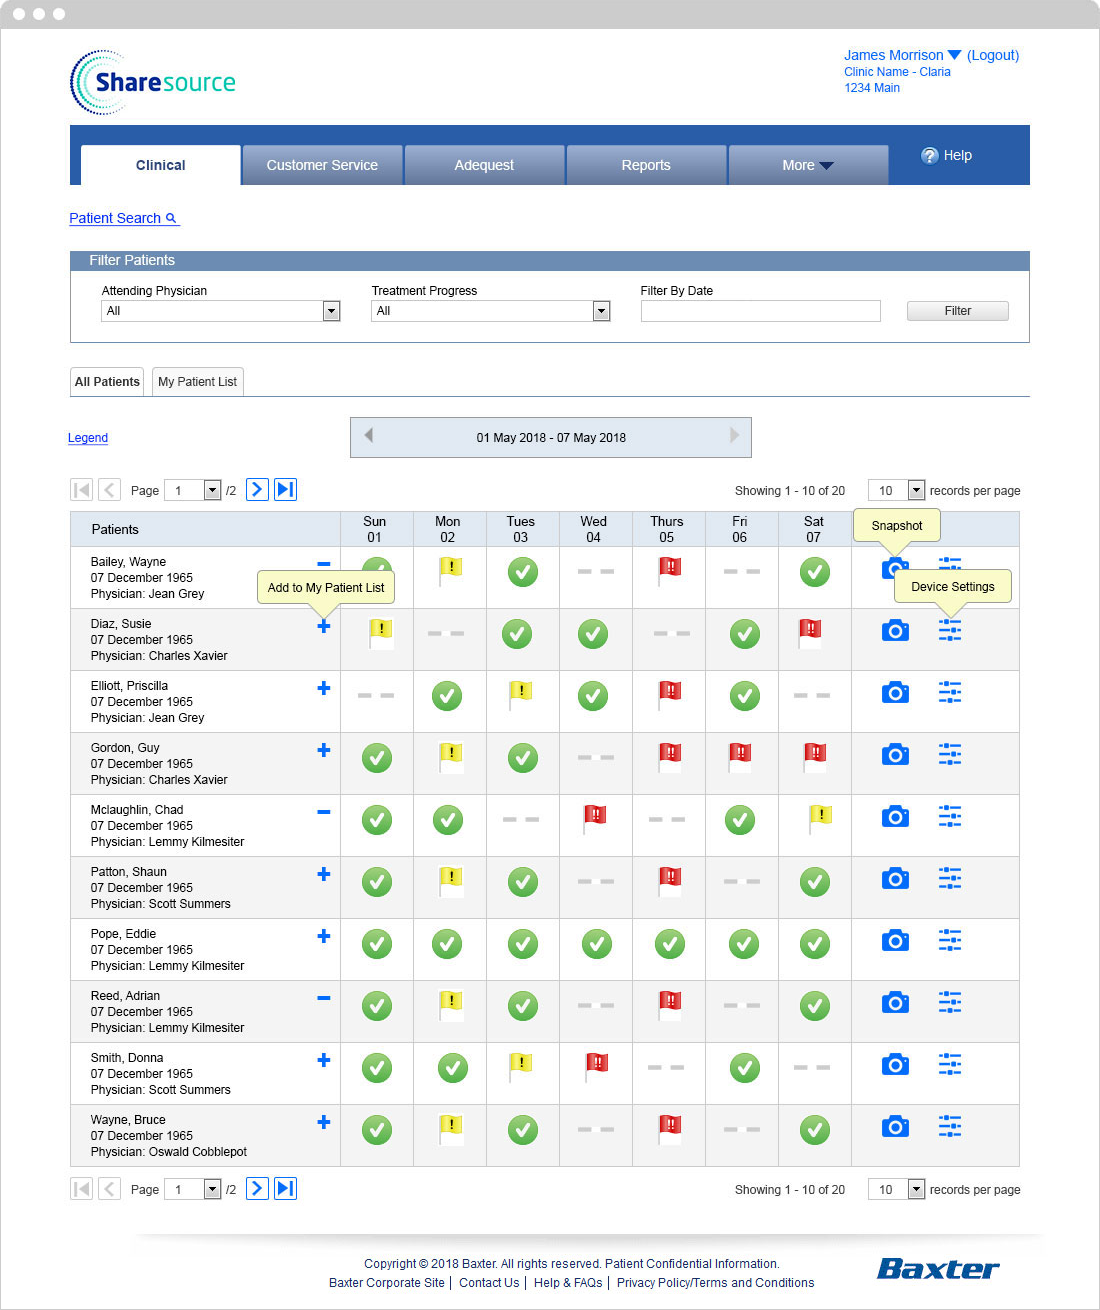
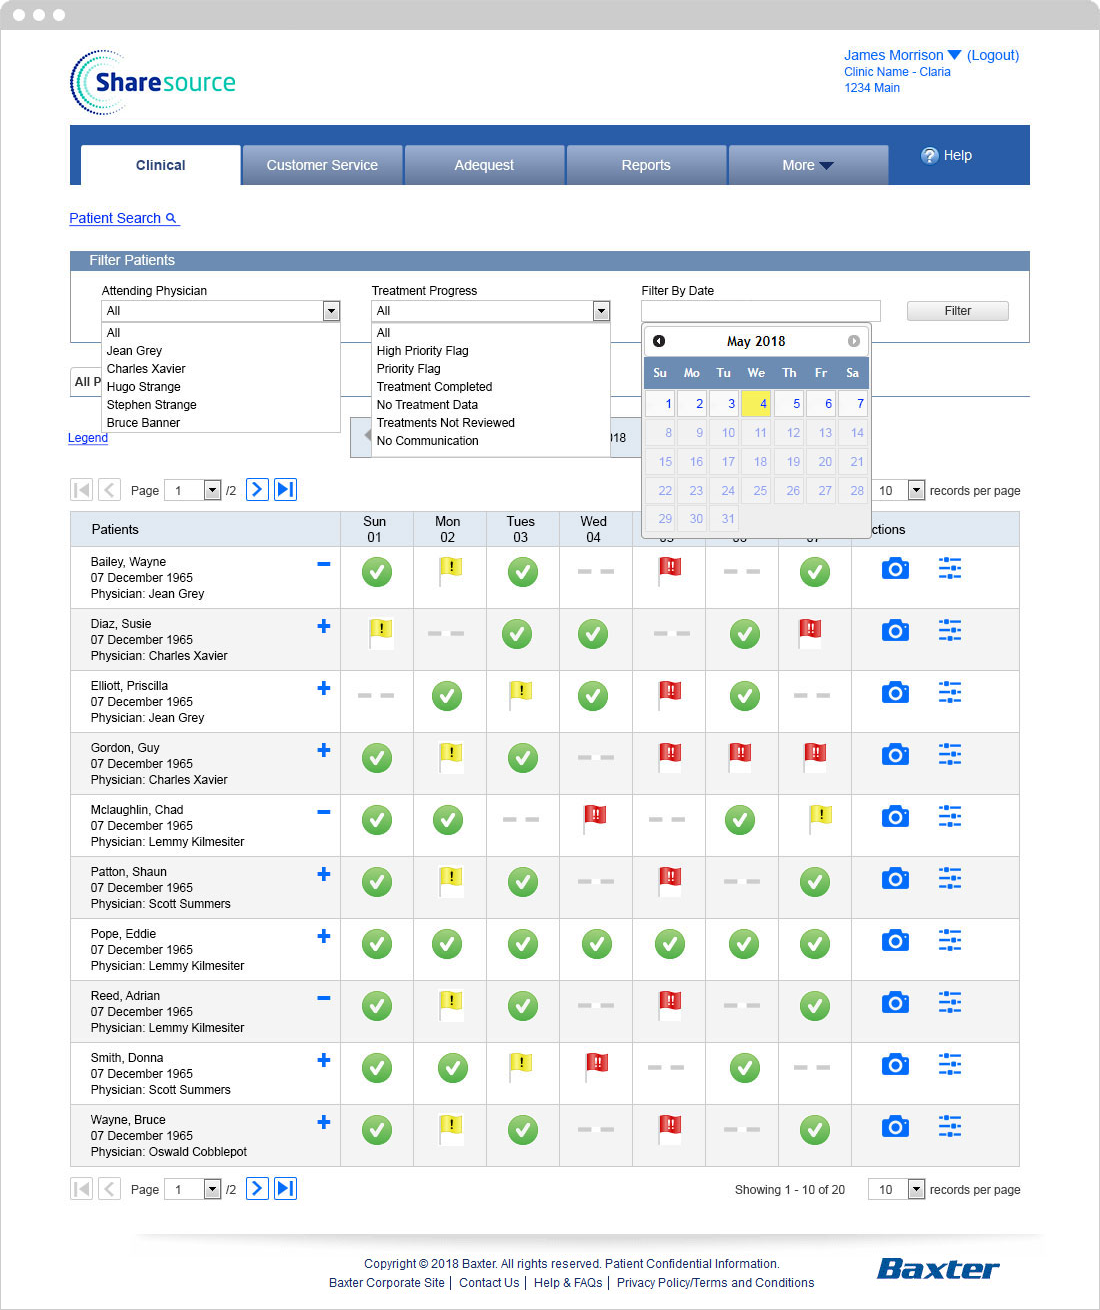
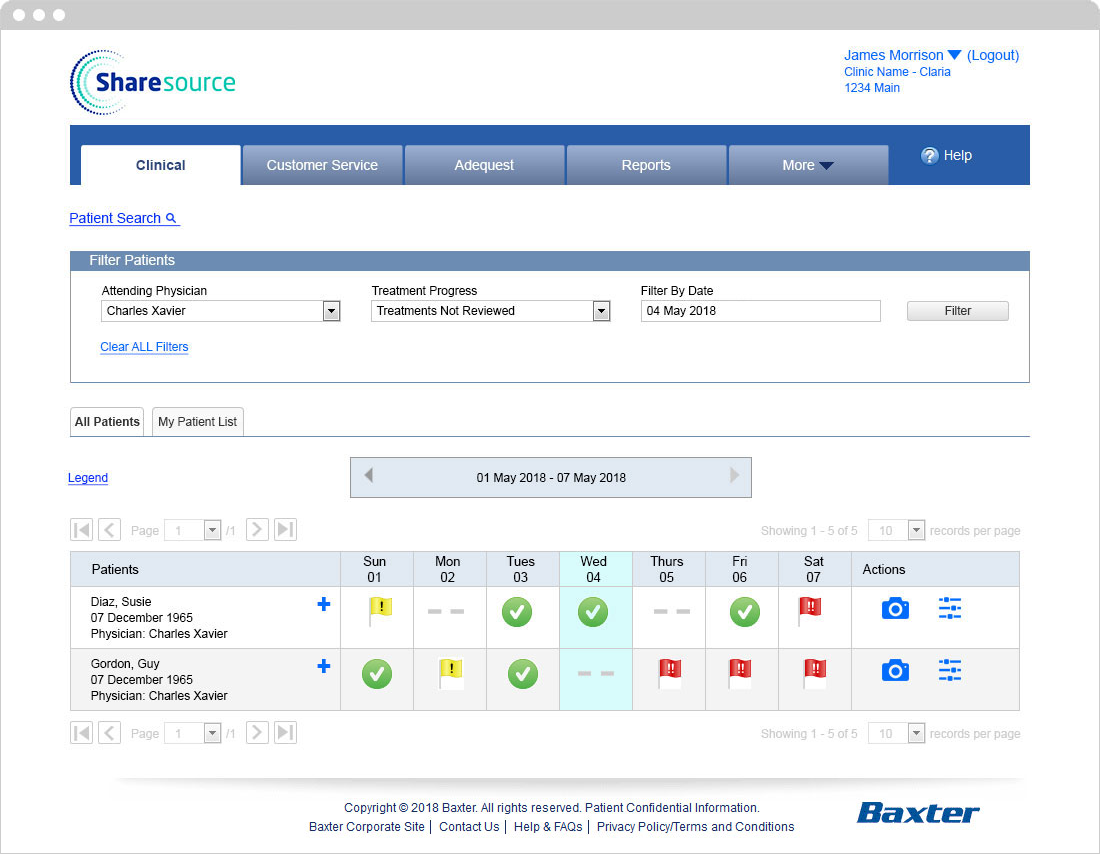
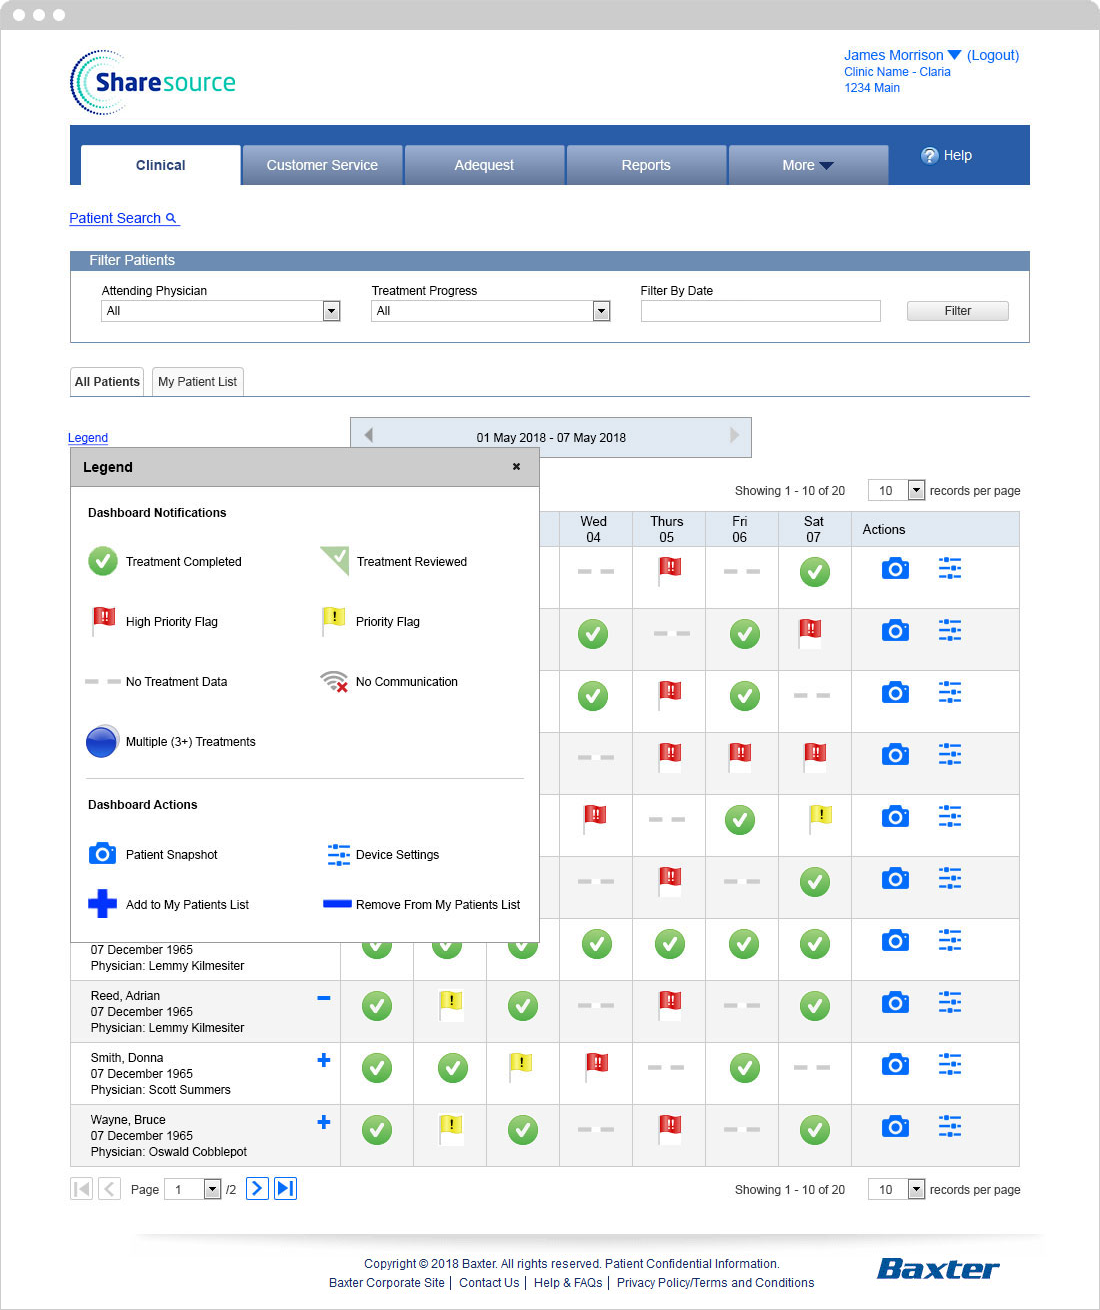
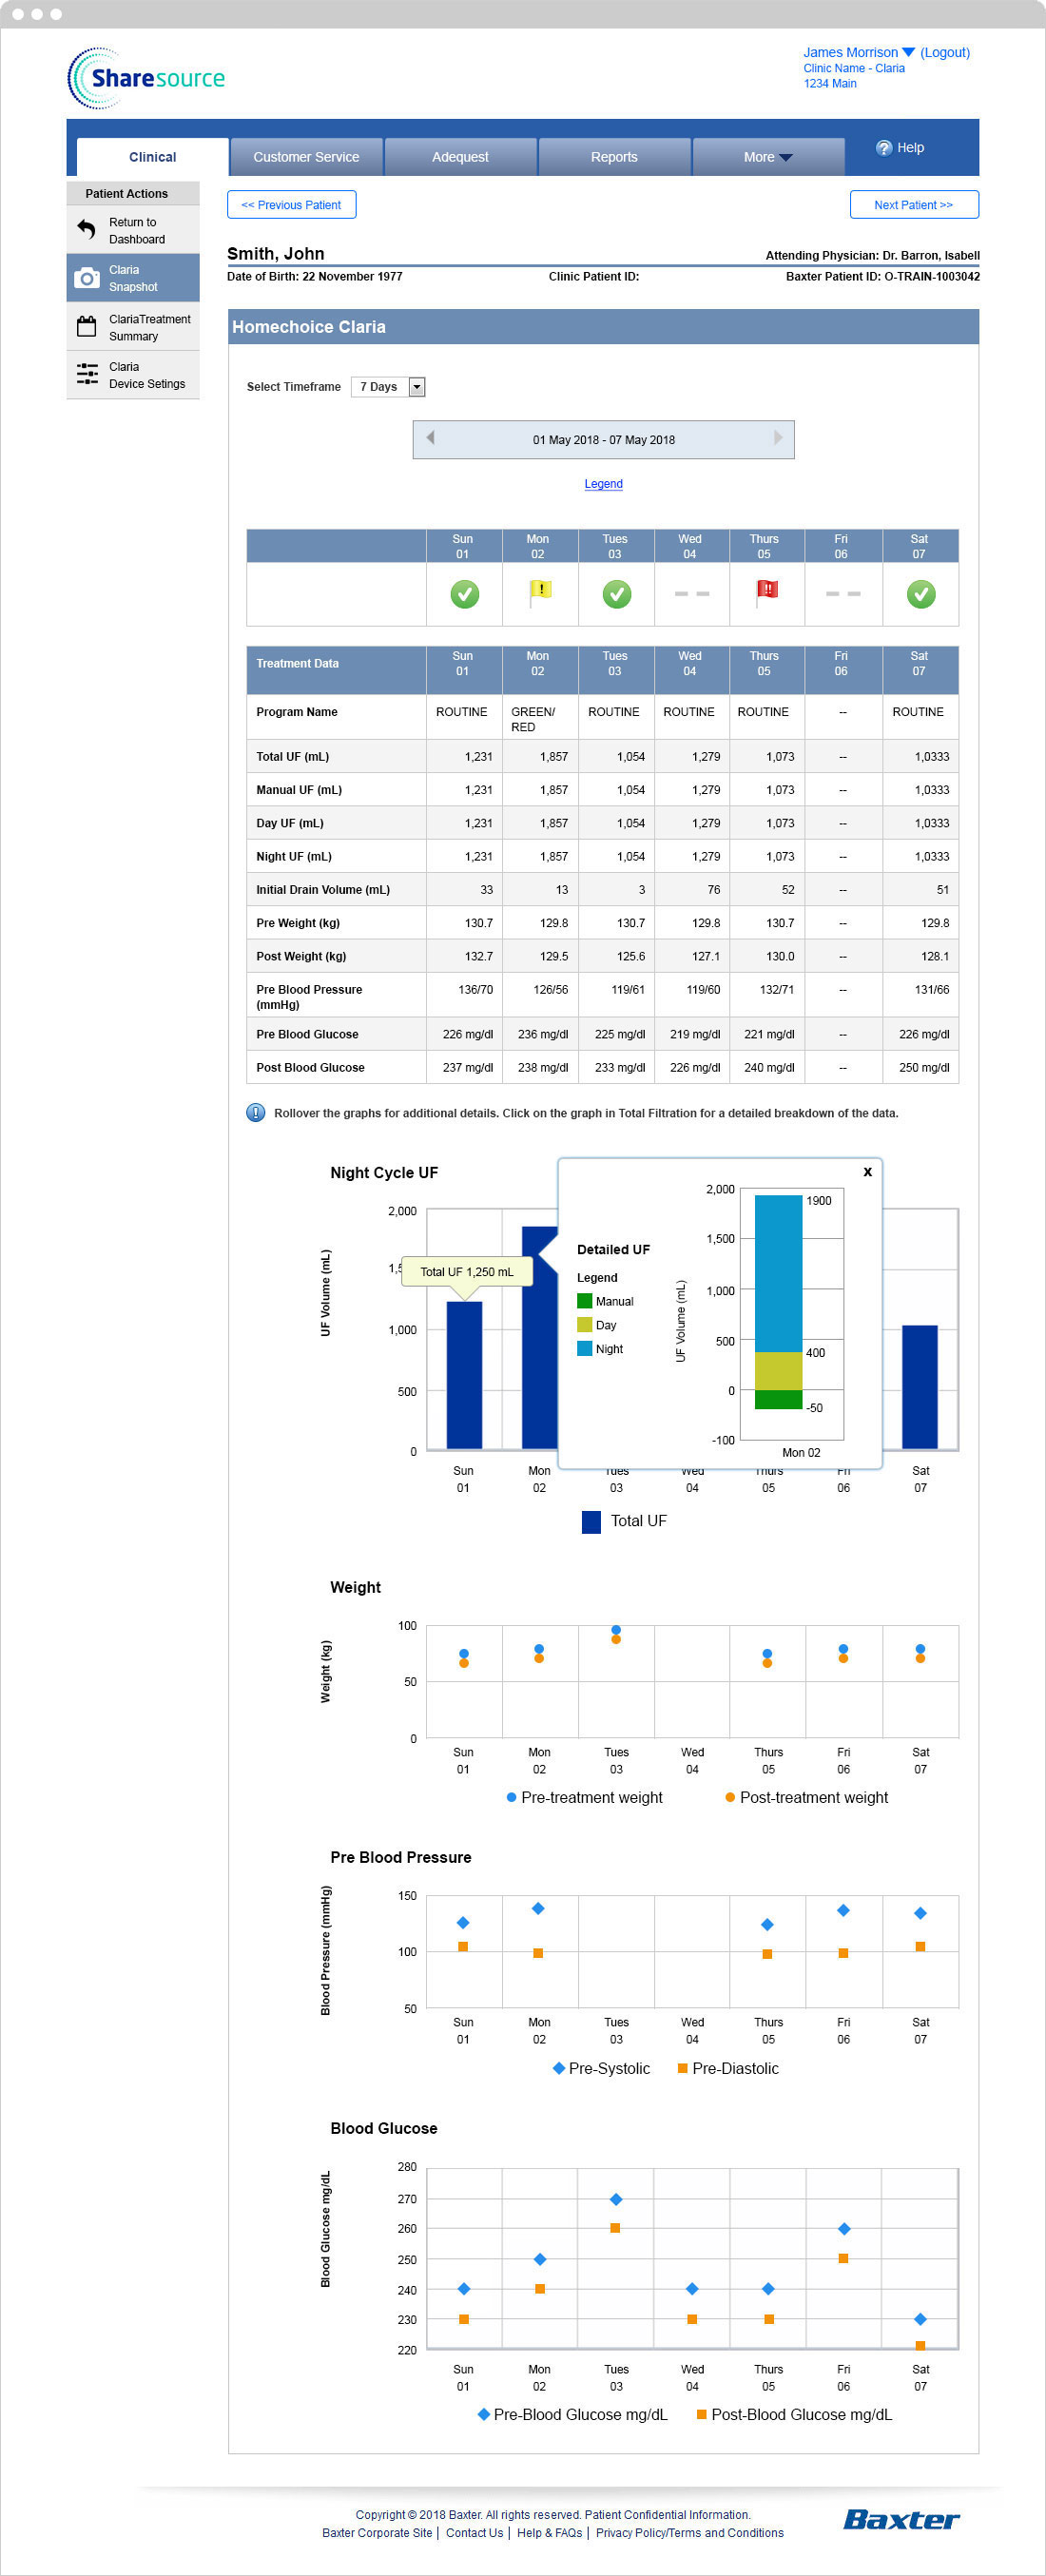
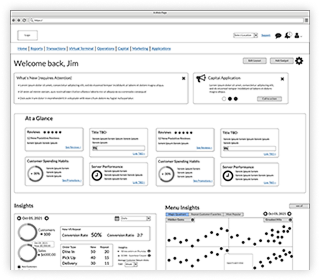
This was my proposal for an updated dashboard. My goal was to layout the information in an easy to read format. There are widgets advertising new features, calling out what requires attention and even the ability to customize the layout to the users needs. The Insights are the analytics we were working on.